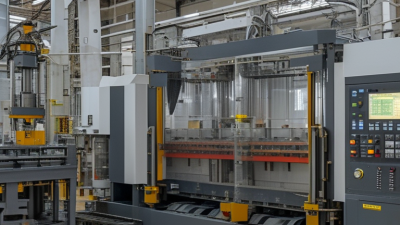
What Is the Ideal Molding Pressure in 2026?

What Is the Ideal Molding Pressure in 2026? The answer is not a single number printed on a machine screen. Ideal molding pressure depends on resin viscosity, part geometry, gate design, mold temperature, and filling speed. A thin automotive connector may require a different setting from a thick medical housing. Both can run on the same press.

In practical production, experienced engineers begin with a controlled pressure range. They review short shots, packing marks, flash, sink marks, and part weight. A stable process often matters more than the highest available pressure. Too little pressure can leave weld lines, voids, or incomplete edges. Too much pressure may create flash, molded-in stress, or difficult ejection. Small details matter. Check the gate.

Modern machines can record pressure curves, cavity pressure, and cycle changes. These records support repeatable decisions and stronger quality control. Material suppliers and mold builders also provide valuable technical guidance, especially for reinforced or recycled polymers. Their data should be verified through trials, not accepted blindly. Real molds behave differently from laboratory samples.

A useful 2026 strategy combines simulation, sensor feedback, and experienced observation. Start conservatively, then adjust molding pressure while monitoring dimensions and surface quality. Keep the barrel temperature, cooling time, and injection speed documented. One setting may appear perfect during a short trial but drift after several hours. That weakness deserves attention.

There is no universal ideal. The best pressure is the lowest stable value that fills the cavity completely, packs the part consistently, and protects the mold. It should also support safe, economical production. Sometimes, our first conclusion is wrong. Reliable optimization requires evidence, patience, and a willingness to revise the process.

What Is the Ideal Molding Pressure in 2026?

What Is Molding Pressure and Why Does It Matter in 2026?

Molding pressure is the force that pushes molten material into a mold cavity. It affects filling, surface quality, dimensions, and internal stress. In 2026, manufacturers still need a process window, not one universal pressure number.

The ideal setting depends on resin temperature, mold design, wall thickness, flow length, and machine condition. Too little pressure can create short shots, weld lines, or weak details.

Excessive pressure may cause flash, burn marks, part distortion, or unnecessary energy use.

Experienced technicians usually begin with a conservative setting and increase pressure gradually. They monitor fill time, cushion, clamp force, part weight, and cavity pressure when available.

A stable process should produce consistent parts across several cycles, not only one successful sample. Material data sheets and validated machine records provide stronger guidance than guesswork. Still, real molds often behave differently from laboratory examples. That is where careful trials matter.

Tips: Record pressure, temperature, speed, and cooling time for every trial. Inspect thin edges and deep ribs first. Use the lowest pressure that fills the cavity completely and holds dimensions reliably. Recheck the setting after material changes, mold maintenance, or seasonal temperature shifts. A pressure value that worked last month may now be slightly wrong. That small difference can become expensive.
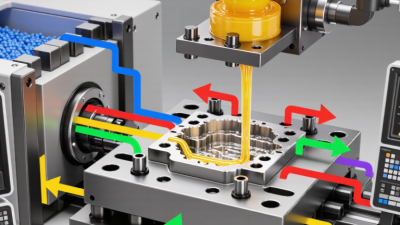
Which Factors Determine the Ideal Molding Pressure?

What Is the Ideal Molding Pressure in 2026?

The ideal molding pressure is not a fixed number. It depends on material viscosity, wall thickness, flow length, gate design, mold temperature, and injection speed. Technical guidance from the American Injection Molding Institute commonly places many thermoplastic injection pressures near 70–140 MPa. That range is useful, but it is not a production recipe.

Material behavior matters most. Filled engineering plastics usually need higher pressure than unfilled polymers. A thin wall may require fast filling and stronger pressure support. A thick section can fill more gently, yet it may need longer packing to control shrinkage. The 2024 Plastics Industry Association market report noted continued growth in recycled and engineered materials, which makes pressure selection less predictable. Recycled content can change viscosity between batches.

Mold geometry can quietly dominate the result. A narrow gate, sharp runner turn, or long flow path increases pressure loss. Mold temperature also changes the picture. A colder cavity freezes the skin early and demands more pressure. Too much pressure creates flash, stress, and difficult ejection. Too little causes short shots and sink marks. The better target is the lowest pressure that fills the cavity and maintains stable dimensions. Cavity sensors and short-shot studies provide stronger evidence than machine settings alone. Real factories still rely on trial and error. That deserves more measurement.

What Is the Ideal Molding Pressure in 2026?

There is no single ideal molding pressure. For injection molding, the correct setting depends on material viscosity, melt temperature, part thickness, flow length, gate design, and machine capability. The chart shows typical starting pressure windows for commonly used thermoplastics.

How to use this chart: Start near the middle of the applicable pressure range, then adjust gradually while checking fill quality, weld lines, flash, sink marks, and part weight. Thin-walled or long-flow parts generally require higher pressure, while thicker or shorter-flow parts may need less.

How Is the Correct Molding Pressure Calculated Step by Step?

What Is the Ideal Molding Pressure in 2026?

How Is the Correct Molding Pressure Calculated Step by Step?

There is no universal molding pressure. The correct value depends on resin viscosity, flow length, wall thickness, gate design, and cavity balance. Grand View Research’s 2024 injection-molded plastics report values the global market above 200 billion dollars, yet market size cannot determine a machine setting. The mold still decides.

Start with projected area. Measure the cavity and runner area in the parting direction. Then use this formula: required clamp force = projected area × cavity pressure × safety factor. Since 1 MPa equals 1 N/mm², a 12,000 mm² projected area, 50 MPa cavity pressure, and 1.15 safety factor require 690,000 N, or about 690 kN. This calculation follows the engineering approach described in the Society of Plastics Engineers’ Injection Molding Handbook.

Then separate cavity pressure from machine pressure. They are not identical. Hydraulic ratio, screw position, melt temperature, and pressure losses can change the result. ISO 20430:2020 supports controlled machine operation, but it does not provide one ideal pressure for every mold.

Use the lowest pressure that fills the cavity completely, holds the gate correctly, and avoids flash. In production trials, increase pressure gradually while checking short shots, part weight, flash, and cavity-pressure curves. A neat formula is only a starting point. Real molds often disagree. That disagreement deserves investigation, not blind correction.

What Is the Ideal Molding Pressure in 2026? - How Is the Correct Molding Pressure Calculated Step by Step?
Step Data Dimension Typical or Example Value Calculation Method Result and Practical Guidance
A. Key Process Inputs
1 Material family General thermoplastics such as PP, PE, ABS, PS, PC, and PA Use the material supplier's processing window, melt-temperature range, and recommended injection-pressure range as the starting reference. The correct pressure is material- and part-dependent; there is no single ideal value for every molding application.
2 Projected area 120 cm², including the projected runner area 120 cm² × 100 = 12,000 mm² Projected area must include every surface exposed to cavity pressure, including runners and cold gates where applicable.
3 Part wall thickness 2.5 mm average wall thickness Measure the nominal wall and identify thin sections, ribs, bosses, and long flow paths. Thin walls and long flow lengths generally require higher injection pressure than short, thick sections.
4 Flow-length-to-thickness ratio Approximately 100:1 for the example part 250 mm flow length ÷ 2.5 mm wall thickness = 100 Higher ratios increase flow resistance and may require higher pressure or additional gates.
5 Estimated cavity pressure 45 MPa for the example Begin with material data, previous validated trials, simulation results, or a short-shot study. Adjust according to filling behavior. A practical starting range for many general thermoplastics is approximately 30–80 MPa in the cavity, but actual requirements can be lower or higher.
B. Step-by-Step Pressure and Clamp-Force Calculation
6 Convert cavity pressure into force 45 MPa cavity pressure 45 MPa = 45 N/mm²
12,000 mm² × 45 N/mm² = 540,000 N
The mold-opening force is approximately 540 kN before applying a safety factor.
7 Apply the clamp-force safety factor 1.15 safety factor 540 kN × 1.15 = 621 kN Required minimum clamp force is approximately 621 kN. A machine rated around 650–700 kN would normally provide a practical margin, subject to machine and mold conditions.
8 Estimate injection pressure at the nozzle 75% pressure-transmission efficiency Nozzle pressure = cavity pressure ÷ transmission efficiency
45 MPa ÷ 0.75 = 60 MPa
Use approximately 60 MPa as the initial estimated nozzle pressure. Actual pressure depends on viscosity, runner design, gate size, screw speed, and filling time.
9 Set the machine pressure limit Initial pressure limit: 70–75 MPa Set the pressure limit slightly above the expected peak pressure so the machine can complete filling without excessive overpressure. Do not use the maximum machine pressure as the normal process setting. The pressure limit is a protection and control boundary, not the target pressure.
10 Determine the switchover point Approximately 95–98% of the cavity filled by volume Switch from velocity control to pressure control before the cavity is fully packed. A properly selected switchover point reduces the risk of flash, hydraulic shock, and uncontrolled pressure spikes.
11 Set holding or packing pressure Approximately 40–70% of peak injection pressure 60 MPa × 40–70% = 24–42 MPa Begin around 24–42 MPa and optimize using part weight, sink marks, dimensions, flash, and gate-seal behavior.
12 Set holding time Start at 3–8 seconds for the example geometry Increase holding time until part weight and critical dimensions stop increasing; this indicates approximate gate freeze. Holding time is controlled by gate size, wall thickness, melt temperature, mold temperature, and material crystallinity.
C. Practical Pressure Reference Ranges
13 General-purpose, easy-flow materials Typical cavity pressure: 25–50 MPa Common for parts with moderate wall thickness, short flow paths, and adequately sized gates. Use the lowest pressure that fills the part completely without short shots, weld-line weakness, or unacceptable surface defects.
14 Engineering thermoplastics Typical cavity pressure: 40–80 MPa Often required for higher-viscosity materials, tighter tolerances, thin walls, or longer flow paths. Higher pressure may increase flash risk, mold deflection, residual stress, and required clamp force.
15 Thin-wall or long-flow applications Typical cavity pressure: 60–120 MPa or more Use flow simulation or a controlled molding trial because pressure loss can increase rapidly along thin or restrictive flow paths. Improve the design first where possible by increasing gate size, adding gates, reducing flow length, or adjusting wall thickness.
16 Recommended pressure optimization rule Lowest stable pressure Reduce pressure in small increments after achieving complete filling, then verify dimensions, weight, appearance, and mechanical performance. The ideal molding pressure is the lowest repeatable pressure that fills and packs the part to specification without flash, excessive stress, burn marks, or dimensional instability.
D. Example Summary
17 Example projected area 12,000 mm² 120 cm² × 100 Includes the part and projected runner area.
18 Example cavity pressure 45 MPa Selected from the estimated material and geometry requirements. Used as the design pressure for clamp-force calculation.
19 Example required clamp force 621 kN minimum calculated value Projected area × cavity pressure × safety factor Select a suitable machine above this calculated requirement after checking mold size, tie-bar spacing, shot capacity, and machine specifications.
20 Example initial process window Injection pressure: about 60 MPa
Pressure limit: about 70–75 MPa
Holding pressure: about 24–42 MPa
Start with calculated values, then validate through short-shot trials and a design-of-experiments approach. Final settings must be confirmed by actual cavity filling, part quality, pressure traces, dimensions, weight, and production repeatability.
Important: Injection pressure, cavity pressure, holding pressure, and clamp force are different measurements. The values above are engineering starting points for a representative thermoplastic molding case, not universal settings. Final pressure should be validated on the actual mold and material using pressure monitoring, short-shot analysis, part inspection, and a stable process window.

How Do Materials and Molding Processes Affect Pressure Settings?

What Is the Ideal Molding Pressure in 2026?

Material choice changes the pressure target more than the calendar year. The Plastics—The Facts 2024 report recorded 413.8 million tonnes of global plastics production in 2023. That scale reflects many resin families, fillers, and recycled grades. Each one flows differently.

A practical starting range is 70–140 MPa for polyethylene and polypropylene. ABS often needs about 80–150 MPa. Polycarbonate and reinforced nylon may require 100–180 MPa, especially in thin sections. These are machine injection-pressure ranges, not universal rules. Cavity pressure can be much lower. Confusing both measurements causes bad decisions.

Process design matters equally. Thin walls, long flow paths, cold molds, and fast filling usually demand higher pressure. A warm mold and balanced runner system can reduce resistance. Glass fiber increases stiffness, but it may restrict flow and raise pressure. Recycled content can also change viscosity between batches. Check it carefully.

Start low.

My own shop-floor approach is conservative, perhaps too conservative. I increase pressure in small steps while watching fill time, cushion, flash, and part weight. ISO 294-1 supports controlled injection-molding test conditions, while ASTM D1238 helps compare melt-flow behavior. The U.S. Department of Energy’s 2023 Industrial Decarbonization Roadmap also emphasizes process efficiency, making unnecessary pressure worth questioning. A stable pressure profile is usually better than a dramatic peak.

How Can Manufacturers Optimize and Verify Molding Pressure?

What Is the Ideal Molding Pressure in 2026?

Manufacturers should stop treating molding pressure as one fixed number. The ideal setting depends on resin viscosity, part thickness, gate design, mold temperature, and injection speed. In practical trials, many engineering thermoplastics may require 60–140 MPa of injection pressure, but this range is only a starting point. A pressure that fills a thin rib may overpack a thick boss.

Optimization begins with a controlled process window. Record peak pressure, pressure at transfer, screw position, fill time, cushion, and part weight. Then change one variable at a time.

The 2024 Plastics Industry Association Size and Impact report valued U.S. plastics shipments at more than $540 billion, showing the scale of production exposed to small process errors. Pressure stability deserves attention.

Verification requires sensors near the cavity, not only the machine display. Compare cavity-pressure curves across repeated cycles, and investigate drift above 5% before changing settings. ISO 20457 also stresses documented mold performance and dimensional control.

Use short-shot studies, sample measurements, and periodic gauge checks.

Our first setup looked stable, yet uneven cooling caused hidden warpage. That result was uncomfortable, but useful.

A smooth curve is not proof of a good part. Correlate pressure data with weight, dimensions, flash, sink marks, and actual assembly fit.